
September 2022
New in dr.corr: Benchmarking of Conversion Machines
Wouldn’t it be good to know how your conversion machine performs in comparison to the same machine in other plants?
In case other plants manage to work with the same machine more efficiently, wouldn’t it be good to share experiences and learn from others?
Benchmarkings are a good way to compare performances and to determine best practice examples.
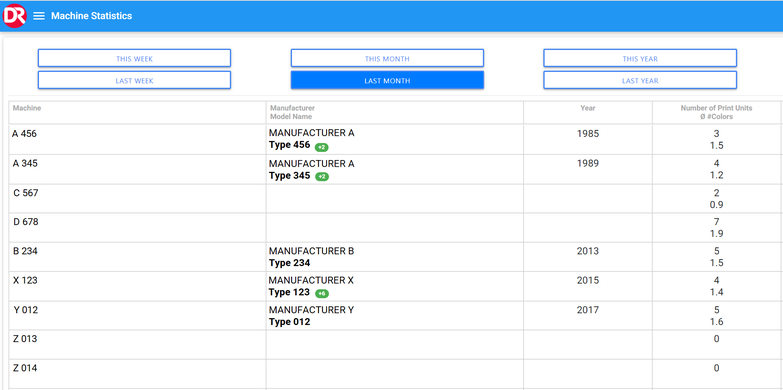
There is a new menu item “Machine Statistics” in dr.corr live, that offers access to statistical data for all your machines. If you are willing to share anonymized data of your machine, you will also gain access to anonymized key performance indicators (KPIs) from other machines of the same type in the dr.corr universe.
All machines that have been configured for the benchmarking, can be recognized by displaying the manufacturer, the model name and the year in the machine statistics. In the example below, 5 machines are included in the benchmarking. As symbolized by the number next to the model name, the first two machines can be compared with 2 other machines from the dr.corr universe and for machine X 123, there are data from 6 other machines available.
If you click on such a machine, a new page opens. All machines are sorted by the year of construction. Your machine is highlighted by a grey background color. All other machines of the same type in the dr.corr universe that are configured for the benchmarking are displayed with an anonymized machine name.
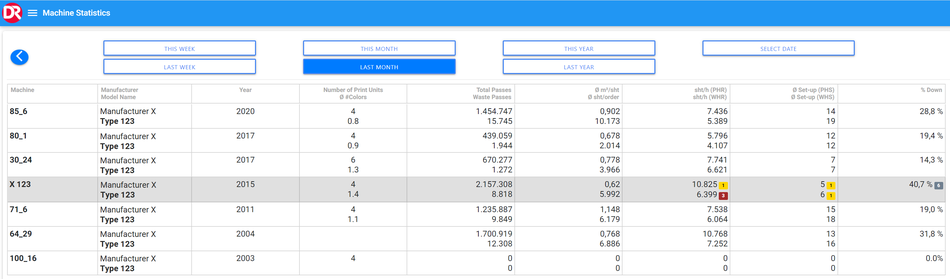
With this table, you can first compare the product mix which the same machine processes in other plants by looking at the average number of colors (Ø #Colors), the average size of the sheets (Ø m²/sht) and the average size of the orders (Ø sht/order). Taking these into consideration you can compare compare several KPIs: machine speed excluding down hours (PHR) or including down hours (WHR), average set-up duration excluding down hours (PHS) or including down hours (WHS) as well as the percentage of downtime.
Your ranking in these KPIs is also displayed in the table (e.g. "3" means your machine the third best of all machines displayed here).
In our example, you can see that your machine performs very well in set-up time as well as in productive run speed (PHR). However, due to your the large percentage of downtime, other plants manage to run their machine faster during work hours (WHR).
In case, a certain machine’s performance raises your interest, you are very welcome to contact the dr.corr team and ask for more details. Dr.corr will contact the respective customer and will initiate an exchange of experiences provided that all parties involved agree to the exchange of personal data.
Back to the News section

DR Software Solutions GmbH
Pettensiedeler Str. 15
90542 Eckental
Germany +49 911 97559988